How much do iPhone apps make at each Top Grossing rank?
The Top Grossing chart is the only public, daily signal of how much iPhone apps earn. Here is how we turn a rank into a monthly revenue range, a calculator you can try, and why every number comes with a factor-of-three warning.
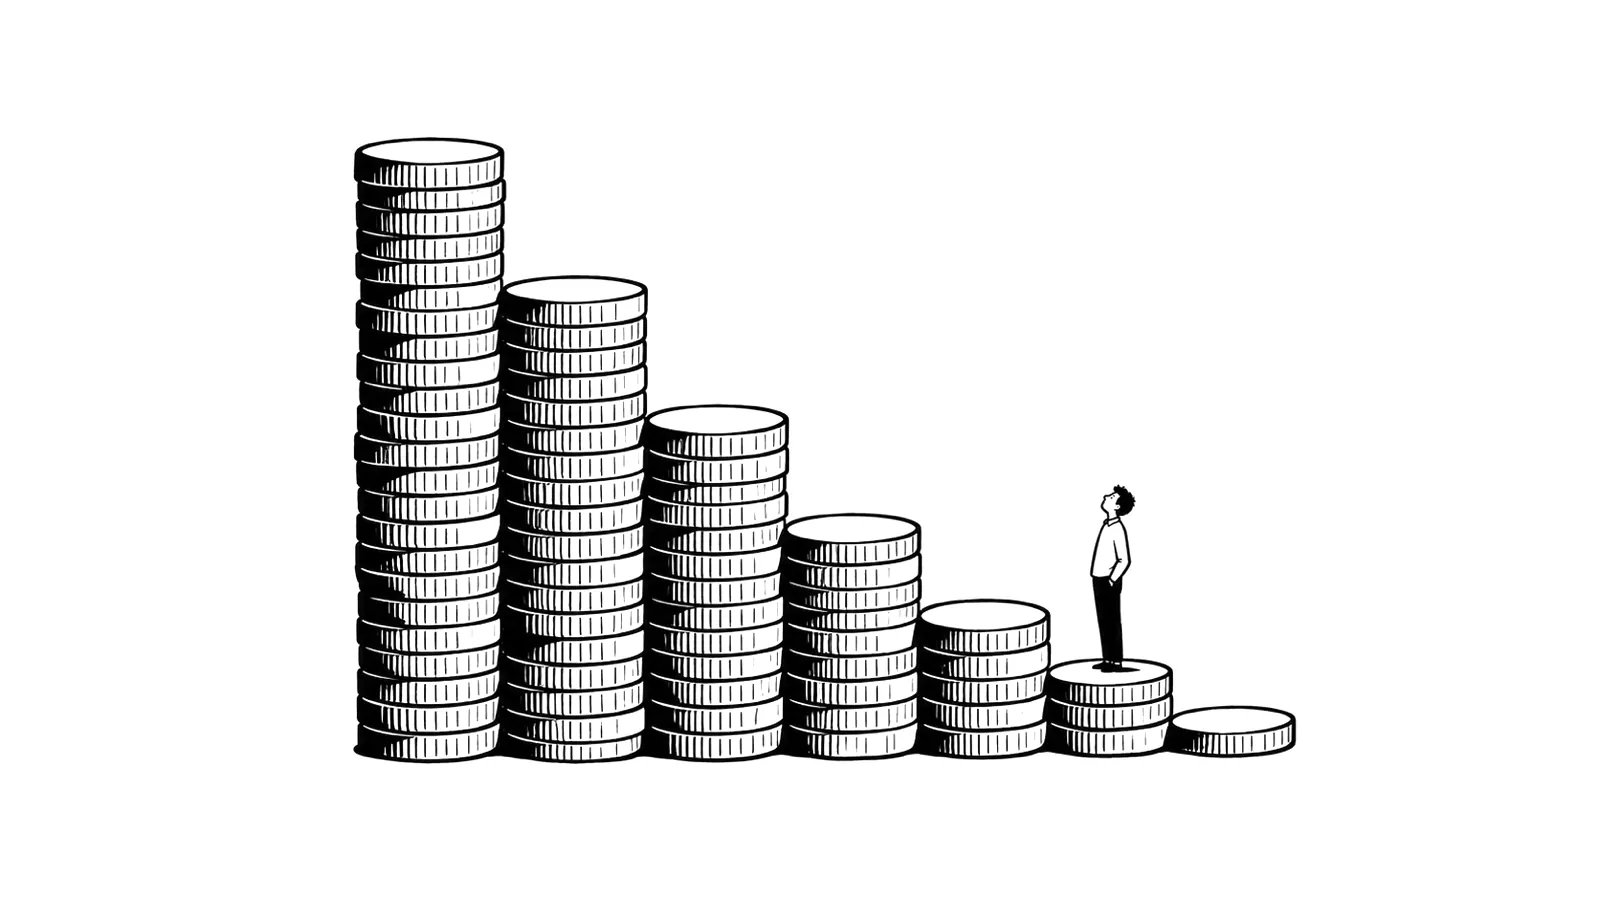
Apple doesn't publish how much any app earns. What it does publish, every day, is the Top Grossing chart: apps ranked by how much money they make through the App Store in each country. A rank isn't a number of dollars, but ranks follow a very regular pattern, and that pattern can be turned into a rough estimate.
Fledly uses this estimate everywhere it shows revenue, from young earners to idea scores. This post shows exactly how it works and how wrong it can be.
The model in one line
For the US App Store, Fledly estimates an app's monthly gross revenue from its overall Top Grossing rank r as:
revenue ≈ $70,000,000 × r−0.75, shown as a range from a third to three times that value.
| Overall rank | Middle estimate (month) | Likely range | Per day |
|---|---|---|---|
| 1 | $70M | $23M–210M | $2.3M |
| 5 | $21M | $7M–63M | $690k |
| 10 | $12.4M | $4.1M–37M | $410k |
| 25 | $6.3M | $2.1M–19M | $206k |
| 50 | $3.7M | $1.2M–11M | $122k |
| 100 | $2.2M | $740k–6.6M | $73k |
| 200 | $1.3M | $440k–3.9M | $43k |
On October 27, 2026, the apps at those ranks included ChatGPT (#1), HBO Max (#10), Facebook (#25) and Township (#50). The overall chart includes games, which take a large share of the top 100.
Where the two numbers come from
The anchor ($70M at #1). Third-party estimates for the US #1 app vary. One public estimate we checked in October 2026 put ChatGPT, the #1 app, at over $100 million a month, possibly worldwide. A US-only figure is lower. $70 million sits between them.
The slope (0.75). Research on App Store charts has found that sales fall with rank as a power law. Garg and Telang (MIS Quarterly, 2013) found a steep curve for paid iPhone apps: the #1 paid app got about 150 times the downloads of the #200, which implies an exponent close to 0.95. Some public estimates for the top 20 grossing apps imply a much flatter curve, around 0.5. We use 0.75, between the two, and the factor-of-three band is wide enough to cover both ends across most of the chart.
Neither number is calibrated against real revenue data. If you have real numbers for an app with a known rank, the curve can be checked. Until then, treat it as an order of magnitude.
What a category rank means
Most apps never reach the overall top 100, but they do appear on their category chart, such as Health & Fitness or Food & Drink. To use those ranks, we compare apps that appear on both the category chart and the overall chart on the same day, and fit a curve between the two ranks.
That works well for categories with several apps in the overall top 100. On October 27, 2026:
| Category | Category #1 ≈ overall rank | Category #10 ≈ overall rank | #10, middle estimate |
|---|---|---|---|
| Games | 6 | 38 | $4.6M |
| Entertainment | 2 | 48 | $3.9M |
| Photo & Video | 2 | 71 | $2.8M |
| Social Networking | 18 | 81 | $2.6M |
| Sports | 31 | 125 | $1.9M |
| Lifestyle | 28 | 136 | $1.8M |
| Health & Fitness | 47 | 154 | $1.6M |
| Productivity | 2 | 177 | $1.4M |
For categories where no app reaches the overall top 100 (Food & Drink, Shopping, Finance, Education, Travel, Business, Utilities, Medical and others), there's nothing to fit. Their #1 earns less than the overall #100, but how much less is unknown. Fledly marks those estimates as guesses and doesn't publish dollar figures based on them.
The same caution applies deep inside fitted categories. The fit rests on the few apps at the top of a category, so a rank of 50 or 100 in Sports or Lifestyle is an extrapolation.
Gross is not what the developer gets
The chart and the estimate are about what customers pay. From that:
- Apple keeps 15% for developers in the Small Business Program (under $1 million in proceeds a year) and for subscriptions after their first year, and 30% otherwise.
- Refunds, taxes and VAT in some countries come off too.
- Paid user acquisition, often the largest cost for apps high on the chart, is not in any of these numbers.
An app at #100 with an estimated $2.2 million a month in gross revenue may be spending much of that on ads. Revenue tells you that a market exists, not that its apps are profitable. We look at that question in how to tell if an app buys its growth.
How to use these estimates
- Compare, don't forecast. The model is good at saying that app A earns about five times app B. It's bad at saying app A earns $412,000.
- Look at many apps. One app's estimate can be off by a factor of three. The combined estimate of ten apps in a concept is more stable.
- Watch ranks over time. An app that holds the same category rank for months has a business. An app that spikes for a week rode a trend or an ad campaign.
Frequently asked questions
How much does the #1 app on the App Store make?
By our model, the US #1 Top Grossing iPhone app takes in roughly $70 million a month in the US, with a plausible range of about $23 million to $210 million. Apple doesn't publish app revenue, so every public figure is an estimate.
How much does an app in the top 100 grossing make?
By our model, the US #100 Top Grossing iPhone app takes in about $2.2 million a month, with a plausible range of about $740,000 to $6.6 million. Apps further up earn more: #50 about $3.7 million and #10 about $12 million a month.
How accurate are app revenue estimates?
For a single app, rank-based estimates are often off by a factor of two or three, because the relationship between rank and revenue varies by day, category and country. They are more useful for comparing apps and for adding up a whole category.
Does Top Grossing rank show revenue or downloads?
Revenue. The Top Grossing chart ranks apps by the money they make through the App Store. Download charts (Top Free and Top Paid) rank by downloads.
How much does Apple take from app revenue?
Apple's standard commission is 30%. Developers in the App Store Small Business Program, and auto-renewing subscriptions after their first year, pay 15%.
Sources
- Garg, R. and Telang, R. (2013). "Inferring App Demand from Publicly Available Data." MIS Quarterly 37(4), 1253–1264.
- Fledly data: US Top Grossing charts, overall and by category, October 27, 2026. Category mappings are fitted daily.
- Apple: App Store Small Business Program.
Keep reading
 Research · October 27, 202622 iPhone app ideas already proven by young apps that earn (October 2026)Not brainstormed: every idea on this list has young iPhone apps on the Top Grossing charts right now, most from several unrelated developers. Scores, evidence and the opening a solo developer could take.
 Method · October 27, 2026How to tell if an app buys its growth before you copy itA Top Grossing rank proves an app earns, not that people look for it. Five public checks show whether a successful app grows on real demand or on ad spend you would have to match.
 Research · October 27, 202610 kinds of apps that earn well but a solo developer can't copyYoung apps in these ten groups are on the Top Grossing charts right now, and they look like easy targets. The money comes from content rights, network effects, licences or hardware, not from the app. Here is how to spot them.